Alemannisch ∙ العربية ∙ беларуская (тарашкевіца) ∙ български ∙ বাংলা ∙ català ∙ нохчийн ∙ čeština ∙ dansk ∙ Deutsch ∙ Ελληνικά ∙ English ∙ British English ∙ Esperanto ∙ español ∙ eesti ∙ euskara ∙ فارسی ∙ suomi ∙ français ∙ Frysk ∙ galego ∙ עברית ∙ hrvatski ∙ magyar ∙ հայերեն ∙ Bahasa Indonesia ∙ Ido ∙ italiano ∙ 日本語 ∙ ქართული ∙ 한국어 ∙ lietuvių ∙ македонски ∙ മലയാളം ∙ Bahasa Melayu ∙ norsk bokmål ∙ Plattdüütsch ∙ Nederlands ∙ norsk nynorsk ∙ norsk ∙ occitan ∙ polski ∙ português ∙ português do Brasil ∙ română ∙ русский ∙ sicilianu ∙ Scots ∙ slovenčina ∙ slovenščina ∙ српски / srpski ∙ svenska ∙ தமிழ் ∙ ไทย ∙ Türkçe ∙ татарча/tatarça ∙ українська ∙ vèneto ∙ Tiếng Việt ∙ 中文(简体) ∙ 中文(繁體) ∙ +/−
ความย่อ
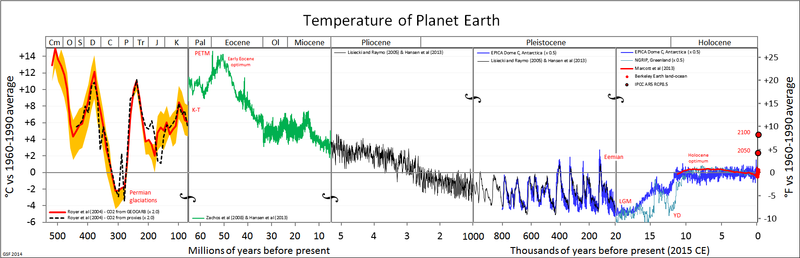
This shows estimates of global average surface air temperature over the ~540 My of the Phanerozoic Eon, since the first major proliferation of complex life forms on our planet. A substantial achievement of the last 30 years of climate science has been the production of a large set of actual measurements of temperature history (from physical proxies), replacing much of the earlier geological induction (i.e. informed guesses). The graph shows selected proxy temperature estimates, which are detailed below.
Because many proxy temperature reconstructions indicate local, not global, temperature -- or ocean, not air, temperature -- substantial approximation may be involved in deriving these global temperature estimates. As a result, the relativities of some of the plotted estimates are approximate, particularly the early ones.
Time scale
Time is plotted forward to the present, taken as 2015 CE. It joins five separate linearly scaled segments, expanding by about an order of magnitude at each vertical break. The breaks are not evenly distributed; rather they are positioned at geologically relevant times, which might be misleading since the break in the last interglacial makes it seem much longer:
At the Mesozoic – Cenozoic boundary, ~65 My ago. This is the "K-T" boundary (now called "Cretaceous–Paleogene"), at which the dinosaurs became extinct.
At the Miocene – Pliocene boundary, ~5.3 My ago.
One million years ago, near the onset of the current, 100,000 year-dominated, glaciation cycle (previous glaciations were shorter).
Near the last glacial maximum, 20,000 years ago.
Temperature scale
Surface air temperature is plotted as anomalies (differences) from the average over the reference interval 1960–1990 (which is about 14°C / 57°F), in both Celsius (left) and Fahrenheit (right).
Data
Panel 1: 540 to 65 million years ago
The panel 1 data is from stable oxygen isotope measurements from the shells of macroscopic marine organisms, collected by Veizer et al (1999), as re-interpreted by Royer et al (2004). The graph effectively reproduces the upper panel of Royer et al's figure 4, but with an expanded range (see below). The orange band shows the effect of extreme assumptions in application of the GEOCARB reconstruction to interpretation, and is not representative of the full uncertainly (which would be much larger).
Because the Royer and Veizer results are indicative of the temperature of the shallow tropical and subtropical seas where the organisms lived, they are unlikely to be fully representative of global average surface air temperature variation. The anomalies are plotted here expanded by a factor of two, as a very approximate conversion. Multiple confounding factors affect interpretation of samples this old, so panel 1 is best viewed as a qualitative indication of temperature (warmer/colder).
Panel 2: 65 to 5.3 million years ago
This data is from the Hansen et al (2013) interpretation of the global collection of oxygen isotope data from microscopic marine organisms of Zachos et al (2008).
This is a direct estimate of global average sea surface temperature, a close analogue of surface air temperature. Hansen et al describe it as a "first estimate", meaning an approximate one, but limited independent corroboration (e.g. Zachos et al (2006) for the Eocene optimum) indicates that it is substantially more quantitative than panel 1.
Panel 3: 5.3 to 1 million years ago
This data is from the Lisiecki and Raymo (2005) global stack of oxygen isotope data from microscopic marine organisms interpreted using the Hansen et al (2013) prescription.
At this scale, the Zachos et al stack (which also covers this interval) is virtually indistinguishable from the Lisiecki and Raymo stack. This is a direct estimate of global average sea surface temperature.
Panel 4: 1 million to 20,000 years ago
Two datasets are plotted:
Lisiecki and Raymo, as in panel 3.
Temperature estimates from stable hydrogen isotope measurements from the EPICA Dome C ice core from central Antarctica These temperature anomaly estimates are polar, not global, and are here divided by a standard polar amplification factor (2.0, as for example in Hansen et al (2013)) to approximately convert them to global estimates.
Panel 5: 20,000 years ago to present (2015)
Five datasets are plotted:
EPICA Dome C, as in panel 4.
Temperature estimates from oxygen isotope measurements on the north Greenland ice core, NGRIP, interpreted using the simple procedure of Johnsen et al (1989). (There are more modern and complex procedures which would yield slightly different interpretations.) Like the EPICA Dome C record, this record is polar, and is shown divided by a polar amplification factor of 2.0. The difference between this and dataset 1. illustrates the polar sea-saw hypothesis.
Global temperature estimates over the ~12,000 years of the Holocene from the multi-proxy collection and interpretation of Marcott et al (2013).
Instrumental (not proxy) data since 1850 from the Berkeley Earth project land-ocean dataset (2014), plotted as decadal means.
Projected temperatures for 2050 and 2100 from the IPCC Fifth Assessment Report's WG1 Summary for Policy Makers (2013) for the RCP8.5 scenario.
Open source
The Microsoft Excel spreadsheet that produced this image is available here: All_palaeotemps.xlsx. Retrieved on 3 May 2014..
References
Veizer, J., Ala, D., Azmy, K., Bruckschen, P., Buhl, D., Bruhn, F., Carden, G.A.F., Diener, A., Ebneth, S., Godderis, Y., Jasper, T., Korte, C., Pawellek, F., Podlaha, O. and Strauss, H. (1999) 87Sr/86Sr, d13C and d18O evolution of Phanerozoic seawater. Chemical Geology 161, 59-88.
↑ Royer, Dana L. and Robert A. Berner, Isabel P. Montañez, Neil J. Tabor, David J. Beerling (2004) CO2 as a primary driver of Phanerozoic climate GSA Today July 2004, volume 14, number 3, pages 4-10, doi:10.1130/1052-5173(2004)014<4:CAAPDO>2.0.CO;2
Royer, Dana (23 March 2014). Dana Royer comment at RealClimate. RealClimate.
↑ Hansen, J., Mki. Sato, G. Russell, and P. Kharecha, 2013: Climate sensitivity, sea level, and atmospheric carbon dioxide. Phil. Trans. R. Soc. A, 371, 20120294. doi:10.1098/rsta.2012.0294
Zachos JC, Dickens GR, Zeebe RE. 2008 An Early Cenozoic perspective on greenhouse warming and carbon-cycle dynamics. Nature 451, 279–283. doi:10.1038/nature06588
Zachos, J. C., Schouten, S., Bohaty, S., Quattlebaum, T., Sluijs, A., Brinkhuis, H., Gibbs, S. & Bralower, T. J. (2006). Extreme warming of mid-latitude coastal ocean during the Paleocene-Eocene Thermal Maximum: Inferences from TEX86 and isotope data. Geology, 34(9), 737-740.
Lisiecki, L. E., & Raymo, M. E. (2005). A Pliocene-Pleistocene stack of 57 globally distributed benthic δ18O records. Paleoceanography, 20(1).
Lisiecki, L. E.; Raymo, M. E. (May 2005). Correction to "A Pliocene-Pleistocene stack of 57 globally distributed benthic d18O records". Paleoceanography: PA2007. doi:10.1029/2005PA001164
Jouzel, J., Masson-Delmotte, V., Cattani, O., Dreyfus, G., Falourd, S., Hoffmann, G., ... & Wolff, E. W. (2007). EPICA Dome C ice core 800kyr deuterium data and temperature estimates. IGBP PAGES/World Data Center for Paleoclimatology data contribution series, 91, 2007.
Andersen, K. K., Azuma, N., Barnola, J. M., Bigler, M., Biscaye, P., Caillon, N., ... & White, J. W. C. (2004). High-resolution record of Northern Hemisphere climate extending into the last interglacial period. Nature, 431(7005), 147-151.
Johnsen, S. J., Dansgaard, W., & White, J. W. C. (1989). The origin of Arctic precipitation under present and glacial conditions. Tellus B, 41(4), 452-468.
Marcott, S. A., Shakun, J. D., Clark, P. U., & Mix, A. C. (2013). A reconstruction of regional and global temperature for the past 11,300 years. Science, 339(6124), 1198-1201.
Berkeley Earth land-ocean dataset (2014). Retrieved on 21 March 2014.
IPCC Fifth Assessment Report WG1 Summary for Policy Makers (2013).
ไฟล, palaeotemps, ไฟล, ประว, ไฟล, หน, าท, ภาพน, การใช, ไฟล, วนกลาง, อม, ลเก, ยวก, บภาพขนาดของต, วอย, างน, กเซล, ความละเอ, ยดอ, กเซล, กเซล, กเซล, ภาพท, ความละเอ, ยดส, งกว, 8206, กเซล, ขนาดไฟล, โลไบต, ชน, ดไมม, image, ปภาพหร, อไฟล, เส, ยงน, นฉบ, บอย, คอมมอนส, รา. ifl prawtiifl hnathimiphaphni karichiflswnklang khxmulekiywkbphaphkhnadkhxngtwxyangni 800 258 phikesl khwamlaexiydxun 320 103 phikesl 640 206 phikesl 1 753 565 phikesl duphaphthimikhwamlaexiydsungkwa 8206 1 753 565 phikesl khnadifl 90 kiolibt chnidimm image png rupphaphhruxiflesiyngni tnchbbxyuthi khxmmxns raylaexiyddanlang epnkhxkhwamthiaesdngphlcak ifltnchbbinkhxmmxns khxmmxnsepnewbistinokhrngkarsahrbekbrwbrwmsuxesri thi khunsamarthchwyid khaxthibayAll palaeotemps png English Global average temperature estimates for the last 540 Myaehlngthima ngankhxngtw data sources are cited belowphusrangsrrkh Glen Fergusewxrchnxun svg version Version francaise svg phaphnimiphaphinrupaebbewketxr SVG hakphaph SVG thaihkaraesdngphldikwa hnathiichphaphnikhwrepliynipichphaph SVG aethn File All palaeotemps png File All palaeotemps svg sahrbkhxmulephimetimekiywkbphaphewketxr duthi karepliynipichphaph SVG inkhxmmxnsnxkcaknisamarthduephimetimekiywkb khxmulekiywkbkarrxngrbphaph SVG sahrbsxftaewrmiediywiki id inphasaxunAlemannisch العربية belaruskaya tarashkevica blgarski ব ল catala nohchijn cestina dansk Deutsch Ellhnika English British English Esperanto espanol eesti euskara فارسی suomi francais Frysk galego עברית hrvatski magyar հայերեն Bahasa Indonesia Ido italiano 日本語 ქართული 한국어 lietuviu makedonski മലയ ള Bahasa Melayu norsk bokmal Plattduutsch Nederlands norsk nynorsk norsk occitan polski portugues portugues do Brasil romană russkij sicilianu Scots slovencina slovenscina srpski srpski svenska தம ழ ithy Turkce tatarcha tatarca ukrayinska veneto Tiếng Việt 中文 简体 中文 繁體 enuxha 1 khwamyx 2 Time scale 3 Temperature scale 4 Data 4 1 Panel 1 540 to 65 million years ago 4 2 Panel 2 65 to 5 3 million years ago 4 3 Panel 3 5 3 to 1 million years ago 4 4 Panel 4 1 million to 20 000 years ago 4 5 Panel 5 20 000 years ago to present 2015 5 Open source 6 References 7 See also 8 karxnuyatichsiththi khwamyx This shows estimates of global average surface air temperature over the 540 My of the Phanerozoic Eon since the first major proliferation of complex life forms on our planet A substantial achievement of the last 30 years of climate science has been the production of a large set of actual measurements of temperature history from physical proxies replacing much of the earlier geological induction i e informed guesses The graph shows selected proxy temperature estimates which are detailed below Because many proxy temperature reconstructions indicate local not global temperature or ocean not air temperature substantial approximation may be involved in deriving these global temperature estimates As a result the relativities of some of the plotted estimates are approximate particularly the early ones Time scale Time is plotted forward to the present taken as 2015 CE It joins five separate linearly scaled segments expanding by about an order of magnitude at each vertical break The breaks are not evenly distributed rather they are positioned at geologically relevant times which might be misleading since the break in the last interglacial makes it seem much longer At the Mesozoic Cenozoic boundary 65 My ago This is the K T boundary now called Cretaceous Paleogene at which the dinosaurs became extinct At the Miocene Pliocene boundary 5 3 My ago One million years ago near the onset of the current 100 000 year dominated glaciation cycle previous glaciations were shorter Near the last glacial maximum 20 000 years ago Temperature scale Surface air temperature is plotted as anomalies differences from the average over the reference interval 1960 1990 which is about 14 C 57 F in both Celsius left and Fahrenheit right Data Panel 1 540 to 65 million years ago The panel 1 data is from stable oxygen isotope measurements from the shells of macroscopic marine organisms collected by Veizer et al 1999 1 as re interpreted by Royer et al 2004 2 The graph effectively reproduces the upper panel of Royer et al s figure 4 but with an expanded range see below The orange band shows the effect of extreme assumptions in application of the GEOCARB reconstruction to interpretation and is not representative of the full uncertainly which would be much larger Because the Royer and Veizer results are indicative of the temperature of the shallow tropical and subtropical seas where the organisms lived 2 they are unlikely to be fully representative of global average surface air temperature variation The anomalies are plotted here expanded by a factor of two as a very approximate conversion Multiple confounding factors affect interpretation of samples this old so panel 1 is best viewed as a qualitative indication of temperature warmer colder 3 Panel 2 65 to 5 3 million years ago This data is from the Hansen et al 2013 4 interpretation of the global collection of oxygen isotope data from microscopic marine organisms of Zachos et al 2008 5 This is a direct estimate of global average sea surface temperature a close analogue of surface air temperature Hansen et al describe it as a first estimate meaning an approximate one but limited independent corroboration e g Zachos et al 2006 6 for the Eocene optimum indicates that it is substantially more quantitative than panel 1 Panel 3 5 3 to 1 million years ago This data is from the Lisiecki and Raymo 2005 7 8 global stack of oxygen isotope data from microscopic marine organisms interpreted using the Hansen et al 2013 4 prescription At this scale the Zachos et al stack which also covers this interval is virtually indistinguishable from the Lisiecki and Raymo stack This is a direct estimate of global average sea surface temperature Panel 4 1 million to 20 000 years ago Two datasets are plotted Lisiecki and Raymo as in panel 3 Temperature estimates from stable hydrogen isotope measurements from the EPICA Dome C ice core from central Antarctica 9 These temperature anomaly estimates are polar not global and are here divided by a standard polar amplification factor 2 0 as for example in Hansen et al 2013 4 to approximately convert them to global estimates Panel 5 20 000 years ago to present 2015 Five datasets are plotted EPICA Dome C as in panel 4 Temperature estimates from oxygen isotope measurements on the north Greenland ice core NGRIP 10 interpreted using the simple procedure of Johnsen et al 1989 11 There are more modern and complex procedures which would yield slightly different interpretations Like the EPICA Dome C record this record is polar and is shown divided by a polar amplification factor of 2 0 The difference between this and dataset 1 illustrates the polar sea saw hypothesis Global temperature estimates over the 12 000 years of the Holocene from the multi proxy collection and interpretation of Marcott et al 2013 12 Instrumental not proxy data since 1850 from the Berkeley Earth project land ocean dataset 2014 13 plotted as decadal means Projected temperatures for 2050 and 2100 from the IPCC Fifth Assessment Report s WG1 Summary for Policy Makers 2013 14 for the RCP8 5 scenario Open source The Microsoft Excel spreadsheet that produced this image is available here All palaeotemps xlsx Retrieved on 3 May 2014 References Veizer J Ala D Azmy K Bruckschen P Buhl D Bruhn F Carden G A F Diener A Ebneth S Godderis Y Jasper T Korte C Pawellek F Podlaha O and Strauss H 1999 87Sr 86Sr d13C and d18O evolution of Phanerozoic seawater Chemical Geology 161 59 88 a b Royer Dana L and Robert A Berner Isabel P Montanez Neil J Tabor David J Beerling 2004 CO2 as a primary driver of Phanerozoic climate GSA Today July 2004 volume 14 number 3 pages 4 10 doi 10 1130 1052 5173 2004 014 lt 4 CAAPDO gt 2 0 CO 2 Royer Dana 23 March 2014 Dana Royer comment at RealClimate RealClimate a b c Hansen J Mki Sato G Russell and P Kharecha 2013 Climate sensitivity sea level and atmospheric carbon dioxide Phil Trans R Soc A 371 20120294 doi 10 1098 rsta 2012 0294 Zachos JC Dickens GR Zeebe RE 2008 An Early Cenozoic perspective on greenhouse warming and carbon cycle dynamics Nature 451 279 283 doi 10 1038 nature06588 Zachos J C Schouten S Bohaty S Quattlebaum T Sluijs A Brinkhuis H Gibbs S amp Bralower T J 2006 Extreme warming of mid latitude coastal ocean during the Paleocene Eocene Thermal Maximum Inferences from TEX86 and isotope data Geology 34 9 737 740 Lisiecki L E amp Raymo M E 2005 A Pliocene Pleistocene stack of 57 globally distributed benthic d18O records Paleoceanography 20 1 Lisiecki L E Raymo M E May 2005 Correction to A Pliocene Pleistocene stack of 57 globally distributed benthic d18O records Paleoceanography PA2007 doi 10 1029 2005PA001164 Jouzel J Masson Delmotte V Cattani O Dreyfus G Falourd S Hoffmann G amp Wolff E W 2007 EPICA Dome C ice core 800kyr deuterium data and temperature estimates IGBP PAGES World Data Center for Paleoclimatology data contribution series 91 2007 Andersen K K Azuma N Barnola J M Bigler M Biscaye P Caillon N amp White J W C 2004 High resolution record of Northern Hemisphere climate extending into the last interglacial period Nature 431 7005 147 151 Johnsen S J Dansgaard W amp White J W C 1989 The origin of Arctic precipitation under present and glacial conditions Tellus B 41 4 452 468 Marcott S A Shakun J D Clark P U amp Mix A C 2013 A reconstruction of regional and global temperature for the past 11 300 years Science 339 6124 1198 1201 Berkeley Earth land ocean dataset 2014 Retrieved on 21 March 2014 IPCC Fifth Assessment Report WG1 Summary for Policy Makers 2013 See also karxnuyatichsiththi iflnixyuphayitsyyaxnuyat khriexthifkhxmmxns aebbaesdngthima xnuyataebbediywkn 3 0 tnchbbkhunsamarth thicaaebngpn thicathasaena aeckcay aelasngngandngklawtxip thicaeriyberiyngihm thicaddaeplngngandngklaw phayitenguxnikhtxipni aesdngthima khuntxngihekiyrtiecakhxngnganxyangehmaasm odyephimlingkipyngsyyaxnuyat aelarabuhakmikarepliynaeplng khunxacthaechnniidinrupaebbidkidtamkhwr aettxngimichinlksnathiaenawaphuihxnuyatsnbsnunkhunhruxkarichngankhxngkhun xnuyataebbediywkn hakkhunddaeplng epliynrup hruxtxetimnganni khuntxngichsyyaxnuyataebbediywknhruxaebbthiehmuxnkbsyyaxnuyatthiichkbnganniethannhttps creativecommons org licenses by sa 3 0 CC BY SA 3 0 Creative Commons Attribution Share Alike 3 0 true truekhabrryayodyyxithyephimkhabrryaythrrthdediywephuxkhyaykhwamwaiflnimixairixethmthiaesdngxyuiniflniprakxbdwyphusrangbangkhathiimmiixethmwikisnethschuxphusrangsrrkh Glen Fergusyuxaraexl https commons wikimedia org wiki user Glen Ferguschuxphuichwikimiediy Glen FergussthanalikhsiththimilikhsiththisyyaxnuyatCreative Commons Attribution ShareAlike 3 0 Unported xngkvsthimakhxngiflkarsrangdngedimodyphuxpohld prawtiifl khlikwnthi ewlaephuxduiflthipraktinkhnann lasud ekasud du ihmkwa 10 ekakwa 10 10 20 50 100 250 500 wnthi ewlarupyxkhnadphuichkhwamehn pccubn11 41 3 emsayn 25571 753 565 90 kiolibt Glen Fergus SVG version 06 17 22 minakhm 25571 754 567 92 kiolibt Glen FergusUpdated for SVG version 16 20 21 minakhm 25571 753 567 93 kiolibt Gergyl Anthropocene 11 45 21 minakhm 25571 752 567 92 kiolibt Glen FergusFix panel 5 axis ticks 10 35 21 minakhm 25571 768 567 89 kiolibt Glen FergusFix border 09 20 21 minakhm 25571 742 547 90 kiolibt Glen FergusImproved graphics incorporate more recent data 17 00 1 mkrakhm 25512 385 1 067 329 kiolibt Glen Fergus Information Description Source Date Author Permission other versions 15 18 12 phvscikayn 25502 385 1 067 327 kiolibt Glen Fergus 14 51 6 kumphaphnth 25502 385 1 067 324 kiolibt Glen Fergus 14 13 6 kumphaphnth 25502 385 1 067 316 kiolibt Glen Fergus lasud ekasud du ihmkwa 10 ekakwa 10 10 20 50 100 250 500 hnathimiphaphni immihnaidoyngmathiphaphnikarichiflswnklang wikixuntxipniichiflni karichbn als wikipedia org Meteorologie karichbn ar wikipedia org علم المناخ القديم karichbn bh wikipedia org प र जलव य ब ज ञ न karichbn bs wikipedia org Paleoklimatologija Oligocen karichbn ca wikipedia org Maxim termic del Cretaci karichbn cs wikipedia org Doba ledova Paleoklimatologie karichbn de wikipedia org Tertiar Diskussion Klimaschutz Archiv karichbn en wikipedia org Gaia hypothesis Talk Geologic temperature record Prehistory of West Virginia Prehistory of Colorado Wikipedia Reference desk Archives Science 2009 September 17 Cretaceous Thermal Maximum User talk HarmonicSeries Talk Climate change Archive 67 Wikipedia Reference desk Archives Science 2017 June 19 karichbn en wikivoyage org Wikivoyage talk Joke articles Time travel karichbn es wikipedia org Paleoclimatologia karichbn eu wikipedia org Paleoklimatologia karichbn fi wikipedia org Paleoklimatologia Fanerotsooinen aioni karichbn frr wikipedia org Phanerozoikum karichbn hr wikipedia org Paleoklimatologija karichbn hu wikipedia org Eghajlat Karbon karichbn hy wikipedia org Անթրոպոգենեզ karichbn it wikipedia org Oligocene karichbn la wikipedia org Calefactio globalis karichbn mk wikipedia org Oligocen karichbn nl wikipedia org Klimaatverandering Gebruiker Eg T2g Kladblok Gebruiker Twanmans Klimaatverandering algemeen karichbn nn wikipedia org Oligocen karichbn ru wikipedia org Antropogenez Paleoklimatologiya Klimaticheskij optimum Obsuzhdenie Proliv Drejka karichbn sh wikipedia org Paleoklimatologija karichbn simple wikipedia org Palaeoclimatology karichbn uk wikipedia org Paleoklimatologiya karichbn war wikipedia org Paleoklimatolohiya karichbn wa wikipedia org Trevens ticreces karichbn zh min nan wikipedia org Ko khi hau ha k karichbn zh wikipedia org 漸新世 古氣候學 User Peacearth sandbox tempkhxmulekiywkbphaph phaphnimikhxmulephimetim sungswnihymacakklxngdicitxlhruxsaeknenxrthisamarthekbkhxmuldngklawiwrwmkbphaphid thaphaphnithukprbprungaekikhhruxepliynaeplngcakedim khxmulbangxyangcayngkhngimepliynaeplngehmuxnphaphthithukprbprungaekikhnnkhwamlaexiydaenwnxn28 34 dpckhwamlaexiydaenwtng28 34 dpc ekhathungcak https th wikipedia org wiki ifl All palaeotemps png, wikipedia, วิกิ หนังสือ, หนังสือ, ห้องสมุด,