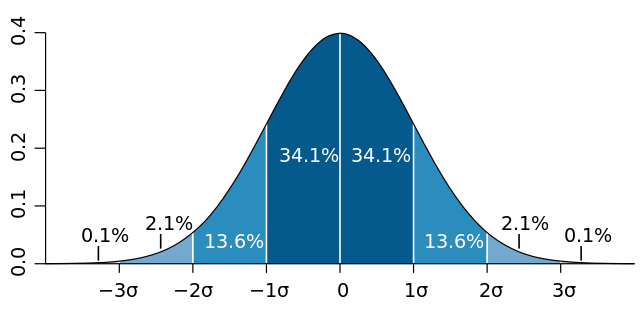
English: Normal distribution curve that illustrates standard deviations. Each band has 1 standard deviation, and the labels indicate the approximate proportion of area (note: these add up to 99.8%, and not 100% because of rounding for presentation.)
Français : Courbe de distribution normale montrant l'écart type. Chaque bande verticale a une largeur d'un écart type et les pourcentages indiquent leur valeur approximative rapportée à la population totale. Note : du fait des arrondis, le total est de 99,8 % au lieu de 100%.
วันที่
แหล่งที่มา
งานของตัว, based (in concept) on figure by Jeremy Kemp, on 2005-02-09
== Summary == Standard deviation diagram, based an original graph by Jeremy Kemp, in 2005-02-09 [http://pbeirne.com/Programming/gaussian.ps]. This figure was started in R using: <pre> x <- seq(-4,4,.1) plot(x,dnorm(x),type
ไฟล, standard, deviation, diagram, ไฟล, ประว, ไฟล, หน, าท, ภาพน, การใช, ไฟล, วนกลาง, อม, ลเก, ยวก, บภาพขนาดของต, วอย, าง, ของไฟล, กเซล, ความละเอ, ยดอ, กเซล, กเซล, กเซล, กเซล, กเซล, ภาพท, ความละเอ, ยดส, งกว, 8206, ไฟล, กเซล, ขนาดไฟล, โลไบต, ปภาพหร, อไฟล, เส, ยง. ifl prawtiifl hnathimiphaphni karichiflswnklang khxmulekiywkbphaphkhnadkhxngtwxyang PNG nikhxngifl SVG ni 400 200 phikesl khwamlaexiydxun 320 160 phikesl 640 320 phikesl 1 024 512 phikesl 1 280 640 phikesl 2 560 1 280 phikesl duphaphthimikhwamlaexiydsungkwa 8206 ifl SVG 400 200 phikesl khnadifl 17 kiolibt rupphaphhruxiflesiyngni tnchbbxyuthi khxmmxns raylaexiyddanlang epnkhxkhwamthiaesdngphlcak ifltnchbbinkhxmmxns khxmmxnsepnewbistinokhrngkarsahrbekbrwbrwmsuxesri thi khunsamarthchwyid khwamyx khaxthibayStandard deviation diagram svg English Normal distribution curve that illustrates standard deviations Each band has 1 standard deviation and the labels indicate the approximate proportion of area note these add up to 99 8 and not 100 because of rounding for presentation Francais nbsp Courbe de distribution normale montrant l ecart type Chaque bande verticale a une largeur d un ecart type et les pourcentages indiquent leur valeur approximative rapportee a la population totale Note nbsp du fait des arrondis le total est de 99 8 nbsp au lieu de 100 wnthi 7 emsayn ph s 2550 aehlngthima ngankhxngtw based in concept on figure by Jeremy Kemp on 2005 02 09 phusrangsrrkh M W Toews ewxrchnxun with decimal comma karxnuyatichsiththi iflnixyuphayitsyyaxnuyatkhriexthifkhxmmxns runaesdngthima 2 5 thwipkhunsamarth thicaaebngpn thicathasaena aeckcay aelasngngandngklawtxip thicaeriyberiyngihm thicaddaeplngngandngklaw phayitenguxnikhtxipni aesdngthima khuntxngihekiyrtiecakhxngnganxyangehmaasm odyephimlingkipyngsyyaxnuyat aelarabuhakmikarepliynaeplng khunxacthaechnniidinrupaebbidkidtamkhwr aettxngimichinlksnathiaenawaphuihxnuyatsnbsnunkhunhruxkarichngankhxngkhunhttps creativecommons org licenses by 2 5 CC BY 2 5 Creative Commons Attribution 2 5 true true i sxrsokhdkhxng SVG nitrwcsxbthuktxngaelw nbsp iflphaphkrafiksewketxrni srangkhunodyich nbsp RkhabrryayodyyxithyephimkhabrryaythrrthdediywephuxkhyaykhwamwaiflnimixairxngkvsBell diagram van standaarddeviatieixethmthiaesdngxyuiniflniprakxbdwychart nbsp xngkvsphusrangbangkhathiimmiixethmwikisnethsyuxaraexl https commons wikimedia org wiki user Mwtoewschuxphusrangsrrkh M W Toewschuxphuichwikimiediy MwtoewssthanalikhsiththimilikhsiththisyyaxnuyatCreative Commons Attribution 2 5 Generic nbsp xngkvswnthisrang wnkxtng7 emsayn 2007 prawtiifl khlikwnthi ewlaephuxduiflthipraktinkhnann wnthi ewlarupyxkhnadphuichkhwamehn pccubn09 06 15 mkrakhm 2558400 200 17 kiolibt GliderMavenAverage is now zero not mu 18 08 7 emsayn 2550400 200 14 kiolibt Petter Strandmark Summary Standard deviation diagram based an original graph by Jeremy Kemp in 2005 02 09 http pbeirne com Programming gaussian ps This figure was started in R using lt pre gt x lt seq 4 4 1 plot x dnorm x type hnathimiphaphni hnatxipni oyngmathiphaphni kd 68 95 99 7 karichiflswnklang wikixuntxipniichiflni karichbn af wikipedia org Standaardafwyking karichbn ar wikipedia org كارل فريدريش غاوس انحراف معياري قاعدة 68 95 99 7 karichbn ast wikipedia org Distribucion de probabilida Esviacion tipica Error estandar karichbn ba wikipedia org Ihtimallyҡ teoriyaһy karichbn be tarask wikipedia org Standartnae adhilenne karichbn be wikipedia org Teoryya imavernascej karichbn bg wikipedia org Veroyatnost Standartno otklonenie karichbn bn wikipedia org সম ভ বন ব ন য স karichbn bs wikipedia org Standardna devijacija Referentni raspon karichbn ca wikipedia org Desviacio tipus Distribucio de probabilitat Calcul de probabilitats Error estandard karichbn cs wikipedia org Smerodatna odchylka Normalni rozdeleni Pravidlo tri sigma karichbn cv wikipedia org Pulayaslăhsen teorijĕ karichbn cy wikipedia org Gwyriad safonol karichbn da wikipedia org Standardafvigelse karichbn de wikipedia org Normalverteilung Riemannsche Vermutung Fehlerbalken Wikipedia Auskunft Archiv 2009 Woche 21 Momentenproblem Benutzerin Diskussion Andrea014 Archiv 2017 IV Benutzer Googolplexian1221 Riemannsche Vermutung karichbn de wikiversity org Kurs Stochastik Normalverteilung karichbn el wikipedia org Kanonikh katanomh 8ewria toy mayroy kyknoy Katanomh pi8anothtas Typikh apoklish karichbn en wikipedia org Normal distribution Probability distribution Standard deviation Jitter Reference range User JeffTL Percentile Zener cards User TimothyPilgrim Standard error Moment problem One and two tailed tests Talk Volcanic winter of 536 dukarichthwolkephimetimkhxngiflnikhxmulekiywkbphaph phaphnimikhxmulephimetim sungswnihymacakklxngdicitxlhruxsaeknenxrthisamarthekbkhxmuldngklawiwrwmkbphaphid thaphaphnithukprbprungaekikhhruxepliynaeplngcakedim khxmulbangxyangcayngkhngimepliynaeplngehmuxnphaphthithukprbprungaekikhnnkhwamkwang400khwamsung200 ekhathungcak https th wikipedia org wiki ifl Standard deviation diagram svg, wikipedia, วิกิ หนังสือ, หนังสือ, ห้องสมุด,