คำอธิบายChanging Face of the North America Nebula.jpg
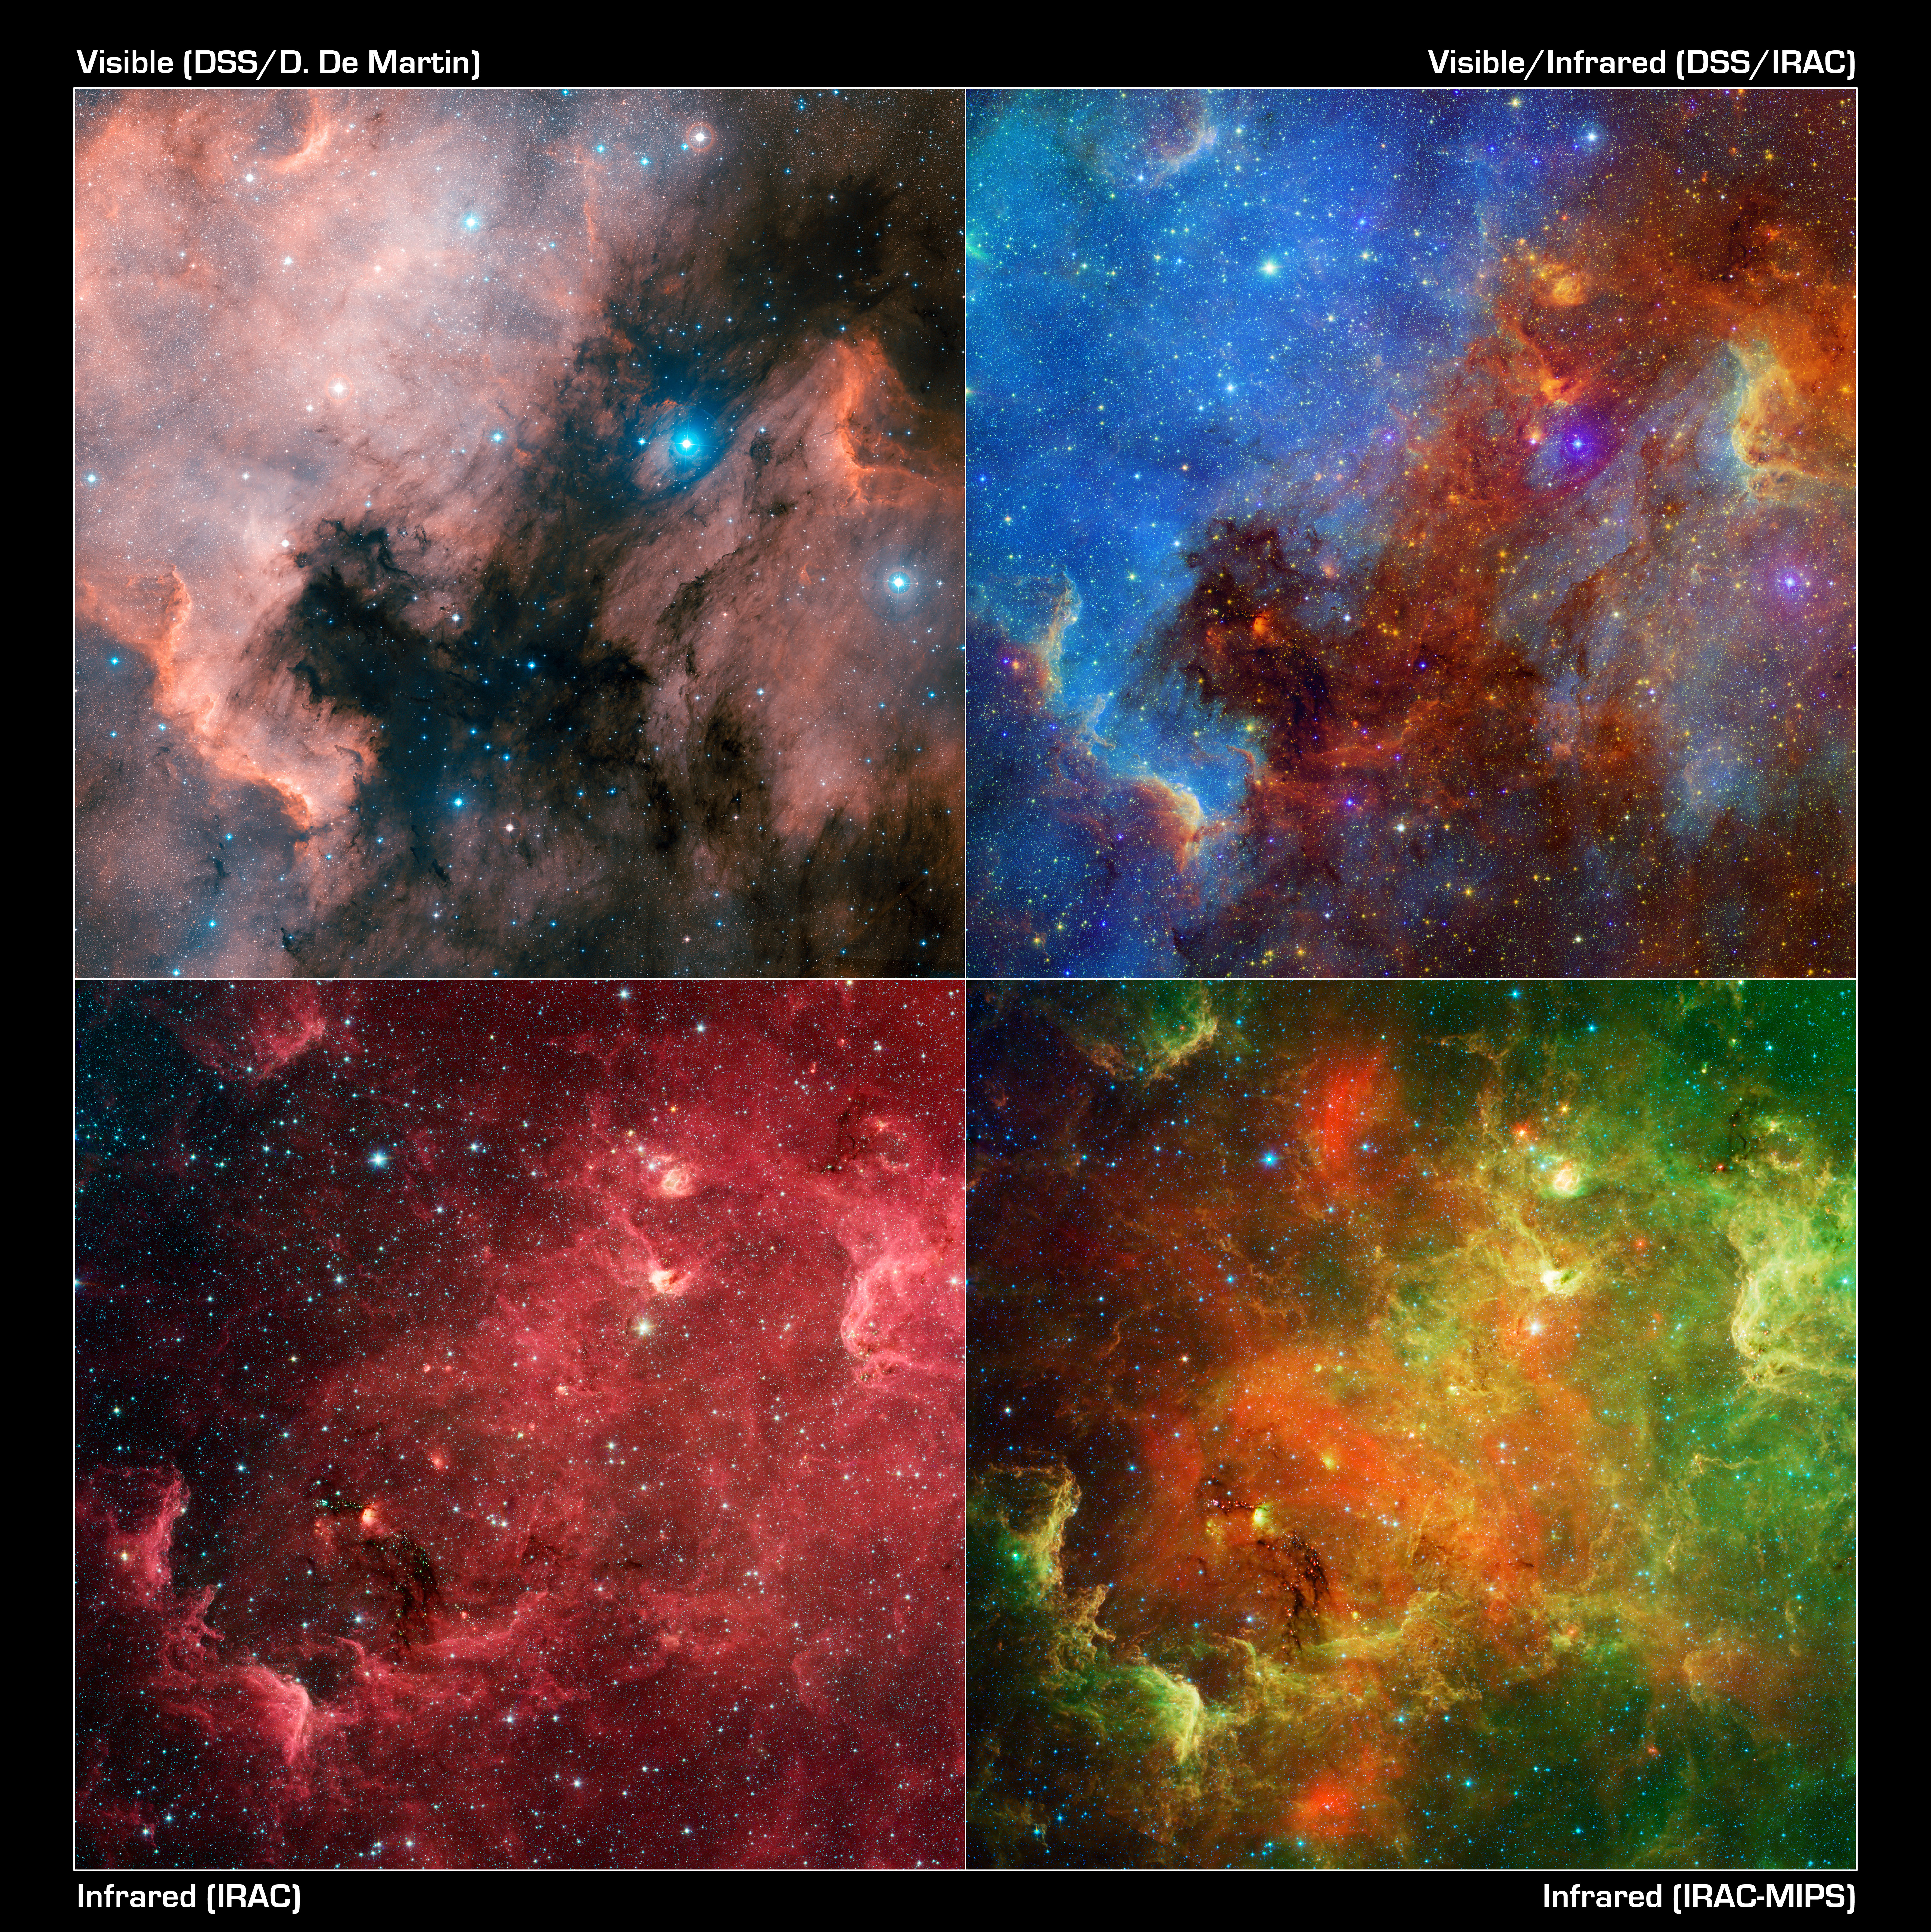
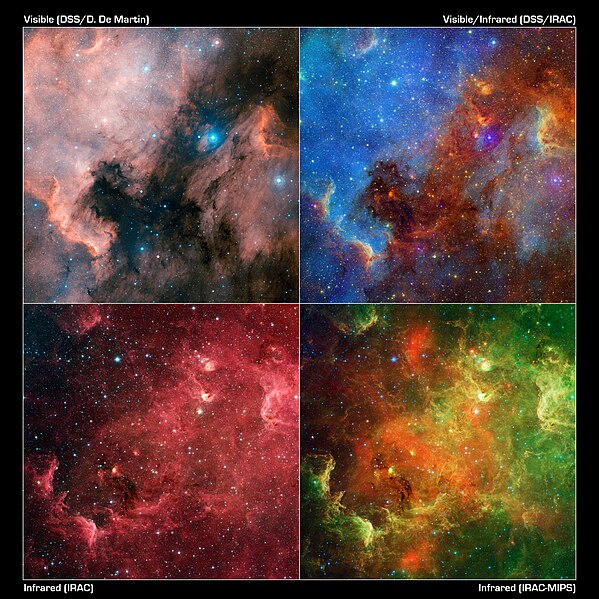
English: This layout of images reveals how the appearance of the North America nebula can change dramatically using different combinations of visible and infrared observations from the Digitized Sky Survey and NASA's Spitzer Space Telescope, respectively.
In this progression, the visible-light view (upper left) shows a striking similarity to the North America continent. Each is cropped to the easterly bulk (thus also the quasi-"Gulf of Mexico" region). The red region to the right is known as the "Pelican nebula," after its resemblance in visible light to a pelican.
The view at upper right includes both visible and infrared observations. The hot gas comprising the North America continent and the Pelican now takes on a vivid blue hue, while red colours display the infrared light. Inky black dust features start to glow in the infrared view.
In the bottom two images, only infrared light from Spitzer is shown -- data from the infrared array camera is on the left, and data from both the infrared array camera and the multi-band imaging photometer, which sees longer wavelengths, is on the right. These pictures look different in part because infrared light can penetrate dust whereas visible light cannot. Dusty, dark clouds in the visible image become transparent in Spitzer's view. In addition, Spitzer's infrared detectors pick up the glow of dusty cocoons enveloping baby stars.
วันที่
แหล่งที่มา
NASA JPL
ผู้สร้างสรรค์
NASA/JPL-Caltech/L. Rebull (SSC/Caltech)
เวอร์ชันอื่น
This file has an extracted image: Herbig-Haro 555.png.
Colour is used to display different parts of the spectrum in each of these images. In the visible-light view (upper right) from the Digitized Sky Survey, colours are shown in their natural blue and red hues. The combined visible/infrared image (upper left) shows visible light as blue, and infrared light as green and red. The infrared array camera (lower left) represents light with a wavelength of 3.6 microns as blue, 4.5 microns as green, 5.8 microns as orange, and 8.0 microns as red. In the final image, incorporating the multi-band imaging photometer data, light with a wavelength of 3.6 microns has been colour coded blue; 4.5-micron light is blue-green; 5.8-micron and 8.0-micron light are green; and 24-micron light is red.
การอนุญาตใช้สิทธิ
Public domainPublic domainfalsefalse
Annotations
InfoField
This image is annotated: View the annotations at Commons
{{Information |Description ={{en|1=This image layout reveals how the appearance of the North America nebula can change dramatically using different combinations of visible and infrared observations from the [[:Category:Digitized
This image layout reveals how the appearance of the North America nebula can change dramatically using different combinations of visible and infrared observations from the Digitized Sky Survey and NASA's Spitzer Space Telescope, respectively.
In this progression, the visible-light view (upper left) shows a striking similarity to the North American continent. The image highlights the eastern seaboard and Gulf of Mexico regions. The red region to the right is known as the "Pelican nebula," after its resemblance in visible light to a pelican.
The view at upper right includes both visible and infrared observations. The hot gas comprising the North America continent and the Pelican now takes on a vivid blue hue, while red colors display the infrared light. Inky black dust features start to glow in the infrared view.
In the bottom two images, only infrared light from Spitzer is shown -- data from the infrared array camera is on the left, and data from both the infrared array camera and the multiband imaging photometer, which sees longer wavelengths, is on the right. These pictures look different in part because infrared light can penetrate dust whereas visible light cannot. Dusty, dark clouds in the visible image become transparent in Spitzer's view. In addition, Spitzer's infrared detectors pick up the glow of dusty cocoons enveloping baby stars.
Color is used to display different parts of the spectrum in each of these images. In the visible-light view (upper right) from the Digitized Sky Survey, colors are shown in their natural blue and red hues. The combined visible/infrared image (upper left) shows visible light as blue, and infrared light as green and red. The infrared array camera (lower left) represents light with a wavelength of 3.6 microns as blue, 4.5 microns as green, 5.8 microns as orange, and 8.0 microns as red. In the final image, incorporating the multiband imaging photometer data, light with a wavelength of 3.6 microns has been color coded blue; 4.5-micron light is blue-green; 5.8-micron and 8.0-micron light are green; and 24-micron light is red.
ความกว้าง
6,000 พิกเซล
ความสูง
6,462 พิกเซล
รูปแบบการบีบอัด
LZW
พิกเซลคอมโพซิชัน
RGB
การจัดวางภาพ
ปกติ
จำนวนคอมโพเนนต์
3
ความละเอียดแนวนอน
300 dpi
ความละเอียดแนวตั้ง
300 dpi
การจัดเรียงข้อมูล
รูปแบบชังกี
ซอฟต์แวร์ที่ใช้
Adobe Photoshop CS3 Macintosh
แก้ไขภาพล่าสุด
12:01, 11 กุมภาพันธ์ 2554
รุ่นเอกซิฟ (Exif)
2.21
สเปซสี
sRGB
มกราคม 17, 2024
ไฟล, changing, face, north, america, nebula, ไฟล, ประว, ไฟล, หน, าท, ภาพน, การใช, ไฟล, วนกลาง, อม, ลเก, ยวก, บภาพขนาดของต, วอย, างน, กเซล, ความละเอ, ยดอ, กเซล, กเซล, กเซล, กเซล, กเซล, กเซล, ภาพท, ความละเอ, ยดส, งกว, 8206, กเซล, ขนาดไฟล, เมกะไบต, ชน, ดไมม, imag. ifl prawtiifl hnathimiphaphni karichiflswnklang khxmulekiywkbphaphkhnadkhxngtwxyangni 599 599 phikesl khwamlaexiydxun 240 240 phikesl 480 480 phikesl 768 768 phikesl 1 023 1 024 phikesl 2 047 2 048 phikesl 6 000 6 003 phikesl duphaphthimikhwamlaexiydsungkwa 8206 6 000 6 003 phikesl khnadifl 16 93 emkaibt chnidimm image jpeg rupphaphhruxiflesiyngni tnchbbxyuthi khxmmxns raylaexiyddanlang epnkhxkhwamthiaesdngphlcak ifltnchbbinkhxmmxns khxmmxnsepnewbistinokhrngkarsahrbekbrwbrwmsuxesri thi khunsamarthchwyid khwamyx khaxthibayChanging Face of the North America Nebula jpg English This layout of images reveals how the appearance of the North America nebula can change dramatically using different combinations of visible and infrared observations from the Digitized Sky Survey and NASA s Spitzer Space Telescope respectively In this progression the visible light view upper left shows a striking similarity to the North America continent Each is cropped to the easterly bulk thus also the quasi Gulf of Mexico region The red region to the right is known as the Pelican nebula after its resemblance in visible light to a pelican The view at upper right includes both visible and infrared observations The hot gas comprising the North America continent and the Pelican now takes on a vivid blue hue while red colours display the infrared light Inky black dust features start to glow in the infrared view In the bottom two images only infrared light from Spitzer is shown data from the infrared array camera is on the left and data from both the infrared array camera and the multi band imaging photometer which sees longer wavelengths is on the right These pictures look different in part because infrared light can penetrate dust whereas visible light cannot Dusty dark clouds in the visible image become transparent in Spitzer s view In addition Spitzer s infrared detectors pick up the glow of dusty cocoons enveloping baby stars wnthi 10 kumphaphnth ph s 2554 aehlngthima NASA JPL phusrangsrrkh NASA JPL Caltech L Rebull SSC Caltech ewxrchnxun This file has an extracted image Herbig Haro 555 png Colour is used to display different parts of the spectrum in each of these images In the visible light view upper right from the Digitized Sky Survey colours are shown in their natural blue and red hues The combined visible infrared image upper left shows visible light as blue and infrared light as green and red The infrared array camera lower left represents light with a wavelength of 3 6 microns as blue 4 5 microns as green 5 8 microns as orange and 8 0 microns as red In the final image incorporating the multi band imaging photometer data light with a wavelength of 3 6 microns has been colour coded blue 4 5 micron light is blue green 5 8 micron and 8 0 micron light are green and 24 micron light is red karxnuyatichsiththi Public domain Public domain false false phaphniepnsatharnsmbti enuxngcakepnphaphthisrangkhunodyxngkhkarbriharkarbinaelaxwkasaehngchati NASA sungtamnoybaydanlikhsiththikhxngnasarabuiwwa phaphaelasuxtang khxngnasaimidrbkarkhumkhrxngodylikhsiththiykewncarabuiwwamilikhsiththi duephimthi hnanoybaydanlikhsiththikhxngnasa hrux noybaykarichphaphkhxng JPL khaetuxn karich olokkhxngnasa ekhruxnghmayaelaekhruxngpradbkhxngnasa thukcakddwykdhmayshrthxemrikainlksna 14 khxngkhxbngkhbthangrachkarshrthxemrika swnthi 1221 ewbistkhxngnasaekbrwbrwmphaphthimacakxngkhkarxwkasosewiyt xngkhkarxwkasaehngchatirsesiy aelaxngkhkarxwkasthimiichxngkhkarxwkaskhxngshrthxemrika epncanwnmak phaphehlaniimcaepntxngepnsatharnsmbtiesmxip phaphhruxsuxthimacak klxngothrthrrsnxwkashbebil xacmilikhsiththi hakphaphhruxsuxnnimidrabuchdecnwamacak sthabnwithyasastrklxngothrthrrsnxwkas 1 phaphhruxsuxthnghmdthimacakekhruxngmuxkhxng okhrngkarsuksadwngxathityaelalmsuriya milikhsiththi karnaphaphhruxsuxcakokhrngkaripichnxkehnuxcakkarichephuxkarkhahruxephuxkarsuksa txngidrbxnuyatkxn 2 phaphthithukkhdeluxkihepn phaphdarasastrpracawn APOD bnewbistkhxng APOD xacmilikhsiththi 3 AnnotationsInfoFieldThis image is annotated View the annotations at Commons1816 1078 1190 1491 6000 6003 Pelican Nebula 263 326 1566 2381 6000 6003 North America Nebula 2518 1316 113 100 6000 6003 Herbig Haro object 555 an embedded protostarkhabrryayodyyxithyephimkhabrryaythrrthdediywephuxkhyaykhwamwaiflnimixairixethmthiaesdngxyuiniflniprakxbdwywnthisrang wnkxtng10 kumphaphnth 2011 prawtiifl khlikwnthi ewlaephuxduiflthipraktinkhnann wnthi ewlarupyxkhnadphuichkhwamehn pccubn19 09 16 kumphaphnth 25546 000 6 003 16 93 emkaibt Originalwana Information Description en 1 This image layout reveals how the appearance of the North America nebula can change dramatically using different combinations of visible and infrared observations from the Category Digitized hnathimiphaphni hnatxipni oyngmathiphaphni enbiwlaxemrikaehnux karichiflswnklang wikixuntxipniichiflni karichbn ar wikipedia org سديم أمريكا الشمالية karichbn cs wikipedia org Mlhovina Severni Amerika Mlhovina Pelikan karichbn fr wikipedia org Nebuleuse de l Amerique du Nord karichbn mk wikipedia org Severna Amerika maglina karichbn my wikipedia org မ က အမ ရ က နက ဗ လ karichbn pl wikipedia org Mglawica Ameryka Polnocna karichbn pt wikipedia org NGC 7000 karichbn vi wikipedia org Tinh van Bắc Mỹ karichbn zh wikipedia org 鵜鶘星雲khxmulekiywkbphaph phaphnimikhxmulephimetim sungswnihymacakklxngdicitxlhruxsaeknenxrthisamarthekbkhxmuldngklawiwrwmkbphaphid thaphaphnithukprbprungaekikhhruxepliynaeplngcakedim khxmulbangxyangcayngkhngimepliynaeplngehmuxnphaphthithukprbprungaekikhnnchuxphaphThis image layout reveals how the appearance of the North America nebula can change dramatically using different combinations of visible and infrared observations from the Digitized Sky Survey and NASA s Spitzer Space Telescope respectively In this progression the visible light view upper left shows a striking similarity to the North American continent The image highlights the eastern seaboard and Gulf of Mexico regions The red region to the right is known as the Pelican nebula after its resemblance in visible light to a pelican The view at upper right includes both visible and infrared observations The hot gas comprising the North America continent and the Pelican now takes on a vivid blue hue while red colors display the infrared light Inky black dust features start to glow in the infrared view In the bottom two images only infrared light from Spitzer is shown data from the infrared array camera is on the left and data from both the infrared array camera and the multiband imaging photometer which sees longer wavelengths is on the right These pictures look different in part because infrared light can penetrate dust whereas visible light cannot Dusty dark clouds in the visible image become transparent in Spitzer s view In addition Spitzer s infrared detectors pick up the glow of dusty cocoons enveloping baby stars Color is used to display different parts of the spectrum in each of these images In the visible light view upper right from the Digitized Sky Survey colors are shown in their natural blue and red hues The combined visible infrared image upper left shows visible light as blue and infrared light as green and red The infrared array camera lower left represents light with a wavelength of 3 6 microns as blue 4 5 microns as green 5 8 microns as orange and 8 0 microns as red In the final image incorporating the multiband imaging photometer data light with a wavelength of 3 6 microns has been color coded blue 4 5 micron light is blue green 5 8 micron and 8 0 micron light are green and 24 micron light is red khwamkwang6 000 phikeslkhwamsung6 462 phikeslrupaebbkarbibxdLZWphikeslkhxmophsichnRGBkarcdwangphaphpkticanwnkhxmophennt3khwamlaexiydaenwnxn300 dpikhwamlaexiydaenwtng300 dpikarcderiyngkhxmulrupaebbchngkisxftaewrthiichAdobe Photoshop CS3 Macintoshaekikhphaphlasud12 01 11 kumphaphnth 2554runexksif Exif 2 21sepssisRGB ekhathungcak https th wikipedia org wiki ifl Changing Face of the North America Nebula jpg, wikipedia, วิกิ หนังสือ, หนังสือ, ห้องสมุด,