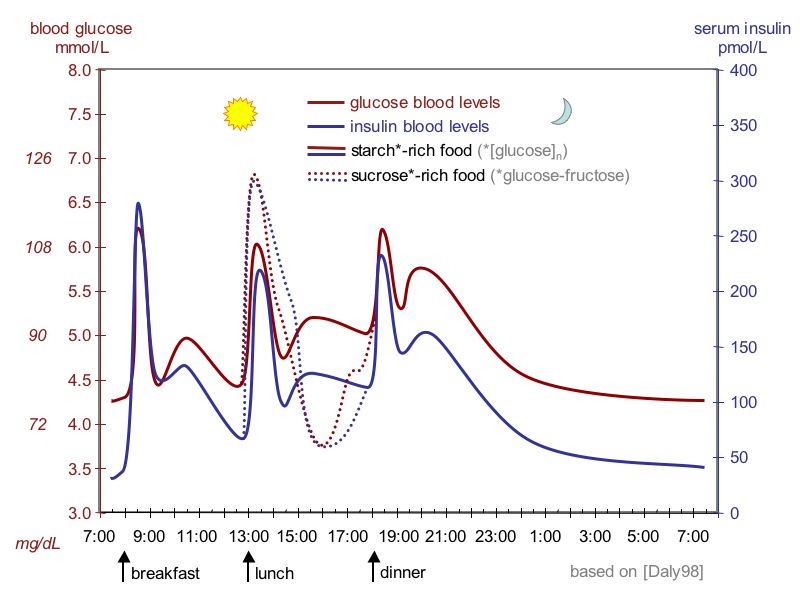
English: idealized curves of human blood glucose and insulin concentrations during the course of a day containing three meals; in addition, effect of sugar-rich meal is highlighted;
Ελληνικά: Ιδανική καμπύλη διακύμανσης γλυκόζης και ινσουλίνης στον άνθρωπο κατά τη διάρκεια μιας ημέρας που περιέχει τρία γεύματα. Επιπλέον, επισημαίνεται η επίδραση του γεύματος πλούσιο σε ζάχαρη (γραμμές με τελίτσες). Μεταφρ. εικ. breakfast=πρωϊνό, lunch=μεσημεριανό, dinner=βραδινό, glucose blood levels=επίπεδα γλυκόζης αίματος, insulin blood levels=επίπεδα γλυκόζης αίματος, starch-rich food=φαγητό προύσιο σε άμυλο, sucrose-rich food=φαγητό πλούσιο σε σάκχαρα. Επεξήγηση εικόνας: Κάτω οριζόντια είναι οι ώρες της ημέρας. Αριστερά κάθετα έχουμε τις μετρήσεις σε mmol/L και σε mg/L. Η κόκκινη γραμμή είναι η διακύμανση της γλυκόζης και η μπλε της ινσουλίνης. Η διακεκομμένη γραμμή είναι η περίπτωση μεσημεριανού πλούσιου σε ζάχαρη. Τα μέγιστα της γλυκόζης είναι μετά τα γεύματα και ανέρχονται στα 6,25 mmol/L ή 113 mg/L. Τα ελάχιστα είναι μερικές ώρες μετά τα γεύματα και κατέρχονται στα 4,5 mmol/L ή 81 mg/L. Όταν το γεύμα είναι πλούσιο σε ζάχαρη έχουμε λίγο μεγαλύτερη άνοδο της γλυκόζης αλλά και μεγαλύτερη κάθοδο γιατί παράγεται περισσότερη ινσουλίνη.
วันที่
แหล่งที่มา
Solimena Lab and Review Suckale Solimena 2008 Frontiers in Bioscience PMID 18508724, preprint PDF from Nature Precedings, original data: Daly et al. 1998 PMID 9625092
ผู้สร้างสรรค์
Jakob Suckale, Michele Solimena
เวอร์ชันอื่น
ไฟล์อื่นที่ใช้ไฟล์นี้:
Glucosa e insulina diarias.jpg
Glucose-day-english.svg
Glucose-insulin-day-german.svg
Grafico glucosio insulina 24h.png
Suckale08 fig3 glucose insulin day BG-language tags.jpg
Image with Bulgarian language tags
Making of the diagram
The figure is based on the research by Mark Daly and colleagues working in the University of Newcastle, UK. The study was published 1998 in the peer reviewed American Journal of Clinical Nutrition. Take a look at the original article on the web. Figure 2 (blood glucose) and figure 3 (serum insulin) were combined into the graphic above. The whiskers for standard error of the mean and some intermediate data points were omitted to make the diagram easier to read. The highest and lowest points have been copied accurately from the research paper. Points were then connected with a curve instead of the straight lines used in the paper. The study is based on 8 test persons, which means that for a different sample, the values could be slightly higher or lower but probably within the standard errors given in the paper (errors are 0.1-0.3 mM for glucose and 10-60 pmol/L for insulin).
PNG version
A PNG version of this JPEG file has also been uploaded to the commons:
ภาพกราฟนี้ ควรจะถูกสร้างใหม่เป็นกราฟิกส์เวกเตอร์ ซึ่งมีข้อดีอีกหลายประการ ดูเพิ่มเติมที่คอมมอนส์:สื่อต้องการเก็บกวาดสำหรับสารสนเทศเพิ่มเติม หากภาพนี้มีในรูปแบบกราฟิกส์เวกเตอร์อยู่แล้ว กรุณาอัปโหลดและแทนที่แม่แบบนี้ด้วย {{vector version available|ชื่อภาพใหม่}} แนะนำเป็นอย่างยิ่งให้ตั้งชื่อไฟล์เวกเตอร์ใหม่นั้นในรูปแบบ "Suckale08 fig3 glucose insulin day.svg" แล้วใส่แม่แบบ Vector version available (หรือ Vva) ซึ่งไม่ต้องใช้พารามิเตอร์ ชื่อภาพใหม่
This graph image was uploaded in the JPEG format even though it consists of non-photographic data. This information could be stored more efficiently or accurately in the PNG or SVG format. If possible, please upload a PNG or SVG version of this image without compression artifacts, derived from a non-JPEG source (or with existing artifacts removed). After doing so, please tag the JPEG version with {{Superseded|NewImage.ext}} and remove this tag. This tag should not be applied to photographs or scans. If this image is a diagram or other image suitable for vectorisation, please tag this image with {{Convert to SVG}} instead of {{BadJPEG}}. If not suitable for vectorisation, use {{Convert to PNG}}. For more information, see {{BadJPEG}}.
{{Information |Description={{en|1=idealised curves of human blood glucose and insulin concentrations during the course of a day containing three meals; in addition, effect of sugar-rich meal is highlighted;}} |Source=Solimena Lab and Review Suckale Solime
ไฟล, suckale08, fig3, glucose, insulin, ไฟล, ประว, ไฟล, หน, าท, ภาพน, การใช, ไฟล, ามโครงการ, อม, ลเก, ยวก, บภาพไม, ภาพท, รายละเอ, ยดส, งกว, าน, suckale08, fig3, glucose, insulin, 8206, กเซล, ขนาดไฟล, โลไบต, ชน, ดไมม, image, jpeg, ปภาพหร, อไฟล, เส, ยงน, นฉบ, บอ. ifl prawtiifl hnathimiphaphni karichiflkhamokhrngkar khxmulekiywkbphaphimmiphaphthimiraylaexiydsungkwani Suckale08 fig3 glucose insulin day jpg 8206 800 600 phikesl khnadifl 60 kiolibt chnidimm image jpeg rupphaphhruxiflesiyngni tnchbbxyuthi khxmmxns raylaexiyddanlang epnkhxkhwamthiaesdngphlcak ifltnchbbinkhxmmxns khxmmxnsepnewbistinokhrngkarsahrbekbrwbrwmsuxesri thi khunsamarthchwyid enuxha 1 khwamyx 2 Making of the diagram 3 PNG version 4 karxnuyatichsiththi khwamyx khaxthibaySuckale08 fig3 glucose insulin day jpg English idealized curves of human blood glucose and insulin concentrations during the course of a day containing three meals in addition effect of sugar rich meal is highlighted Ellhnika Idanikh kampylh diakymanshs glykozhs kai insoylinhs ston an8rwpo kata th diarkeia mias hmeras poy periexei tria geymata Epipleon epishmainetai h epidrash toy geymatos ploysio se zaxarh grammes me telitses Metafr eik breakfast prwino lunch meshmeriano dinner bradino glucose blood levels epipeda glykozhs aimatos insulin blood levels epipeda glykozhs aimatos starch rich food faghto proysio se amylo sucrose rich food faghto ploysio se sakxara Epe3hghsh eikonas Katw orizontia einai oi wres ths hmeras Aristera ka8eta exoyme tis metrhseis se mmol L kai se mg L H kokkinh grammh einai h diakymansh ths glykozhs kai h mple ths insoylinhs H diakekommenh grammh einai h periptwsh meshmerianoy ploysioy se zaxarh Ta megista ths glykozhs einai meta ta geymata kai anerxontai sta 6 25 mmol L h 113 mg L Ta elaxista einai merikes wres meta ta geymata kai katerxontai sta 4 5 mmol L h 81 mg L Otan to geyma einai ploysio se zaxarh exoyme ligo megalyterh anodo ths glykozhs alla kai megalyterh ka8odo giati paragetai perissoterh insoylinh wnthi ph s 2550 aehlngthima Solimena Lab and Review Suckale Solimena 2008 Frontiers in Bioscience PMID 18508724 preprint PDF from Nature Precedings original data Daly et al 1998 PMID 9625092 phusrangsrrkh Jakob Suckale Michele Solimena ewxrchnxun iflxunthiichiflni Glucosa e insulina diarias jpg Glucose day english svg Glucose insulin day german svg Grafico glucosio insulina 24h png Suckale08 fig3 glucose insulin day BG language tags jpg Image with Bulgarian language tags Making of the diagram The figure is based on the research by Mark Daly and colleagues working in the University of Newcastle UK The study was published 1998 in the peer reviewed American Journal of Clinical Nutrition Take a look at the original article on the web Figure 2 blood glucose and figure 3 serum insulin were combined into the graphic above The whiskers for standard error of the mean and some intermediate data points were omitted to make the diagram easier to read The highest and lowest points have been copied accurately from the research paper Points were then connected with a curve instead of the straight lines used in the paper The study is based on 8 test persons which means that for a different sample the values could be slightly higher or lower but probably within the standard errors given in the paper errors are 0 1 0 3 mM for glucose and 10 60 pmol L for insulin PNG version A PNG version of this JPEG file has also been uploaded to the commons http en wikipedia org wiki File Suckale08 fig3 glucose insulin day png karxnuyatichsiththi iflnixyuphayitsyyaxnuyat khriexthifkhxmmxns aebbaesdngthima xnuyataebbediywkn 3 0 tnchbbkhunsamarth thicaaebngpn thicathasaena aeckcay aelasngngandngklawtxip thicaeriyberiyngihm thicaddaeplngngandngklaw phayitenguxnikhtxipni aesdngthima khuntxngihekiyrtiecakhxngnganxyangehmaasm odyephimlingkipyngsyyaxnuyat aelarabuhakmikarepliynaeplng khunxacthaechnniidinrupaebbidkidtamkhwr aettxngimichinlksnathiaenawaphuihxnuyatsnbsnunkhunhruxkarichngankhxngkhun xnuyataebbediywkn hakkhunddaeplng epliynrup hruxtxetimnganni khuntxngichsyyaxnuyataebbediywknhruxaebbthiehmuxnkbsyyaxnuyatthiichkbnganniethannhttps creativecommons org licenses by sa 3 0 CC BY SA 3 0 Creative Commons Attribution Share Alike 3 0 true true phaphkrafni khwrcathuksrangihmepnkrafiksewketxr sungmikhxdixikhlayprakar duephimetimthikhxmmxns suxtxngkarekbkwadsahrbsarsnethsephimetim hakphaphnimiinrupaebbkrafiksewketxrxyuaelw krunaxpohldaelaaethnthiaemaebbnidwy vector version available i chuxphaphihm i aenanaepnxyangyingihtngchuxiflewketxrihmnninrupaebb Suckale08 fig3 glucose insulin day svg aelwisaemaebb Vector version available hrux Vva sungimtxngichpharamietxr chuxphaphihmThis graph image was uploaded in the JPEG format even though it consists of non photographic data This information could be stored more efficiently or accurately in the PNG or SVG format If possible please upload a PNG or SVG version of this image without compression artifacts derived from a non JPEG source or with existing artifacts removed After doing so please tag the JPEG version with Superseded NewImage ext and remove this tag This tag should not be applied to photographs or scans If this image is a diagram or other image suitable for vectorisation please tag this image with Convert to SVG instead of BadJPEG If not suitable for vectorisation use Convert to PNG For more information see BadJPEG khabrryayodyyxithyephimkhabrryaythrrthdediywephuxkhyaykhwamwaiflnimixairixethmthiaesdngxyuiniflniprakxbdwysthanalikhsiththimilikhsiththisyyaxnuyatCreative Commons Attribution ShareAlike 3 0 Unported nbsp xngkvswnthisrang wnkxtng2007 prawtiifl khlikwnthi ewlaephuxduiflthipraktinkhnann wnthi ewlarupyxkhnadphuichkhwamehn pccubn21 09 17 singhakhm 2552800 600 60 kiolibt Jakob Suckale axes have been labelled more clearly the conventional mg dl in addition to the standard unit mmol L has been added for blood glucose 21 10 25 mithunayn 2551945 731 148 kiolibt Jasu Information Description en 1 idealised curves of human blood glucose and insulin concentrations during the course of a day containing three meals in addition effect of sugar rich meal is highlighted Source Solimena Lab and Review Suckale Solime hnathimiphaphni hnatxipni oyngmathiphaphni natalineluxd karichiflkhamokhrngkar wikixuntxipniichiflni karichbn ar wikipedia org سكر الدم karichbn el wikipedia org Epipedo sakxaroy sto aima karichbn en wikipedia org Talk Blood sugar level User Jakob Suckale User Jakob Suckale panel bottom karichbn en wikibooks org Metabolomics Applications Nutrition Animal Models Principles of Biochemistry Glucose Glycogen and Diabetes karichbn en wikiversity org Motivation and emotion Book 2015 Hanger karichbn fr wiktionary org glucose karichbn hi wikipedia org इन स ल न karichbn kn wikipedia org ರಕ ತದಲ ಲ ನ ಸಕ ಕರ karichbn ml wikipedia org രക തത ത ല പഞ ചസ ര karichbn pt wikipedia org Glicemia karichbn sh wikipedia org Inzulin karichbn sr wikipedia org Insulin karichbn ta wikipedia org இரத தச சர க கர இன ச ல ன karichbn zh min nan wikipedia org Hiat thn g karichbn zh wikipedia org 血糖khxmulekiywkbphaph phaphnimikhxmulephimetim sungswnihymacakklxngdicitxlhruxsaeknenxrthisamarthekbkhxmuldngklawiwrwmkbphaphid thaphaphnithukprbprungaekikhhruxepliynaeplngcakedim khxmulbangxyangcayngkhngimepliynaeplngehmuxnphaphthithukprbprungaekikhnnkhwamehnifl JPEGAppleMark ekhathungcak https th wikipedia org wiki ifl Suckale08 fig3 glucose insulin day jpg, wikipedia, วิกิ หนังสือ, หนังสือ, ห้องสมุด,