This image was uploaded in the JPEG format even though it consists of non-photographic data. This information could be stored more efficiently or accurately in the PNG or SVG format. If possible, please upload a PNG or SVG version of this image without compression artifacts, derived from a non-JPEG source (or with existing artifacts removed). After doing so, please tag the JPEG version with {{Superseded|NewImage.ext}} and remove this tag. This tag should not be applied to photographs or scans. For more information, see {{BadJPEG}}.
ความย่อ
A comparison of predictions of global warming from 8 different climate models assuming the SRES A2 emissions scenario.
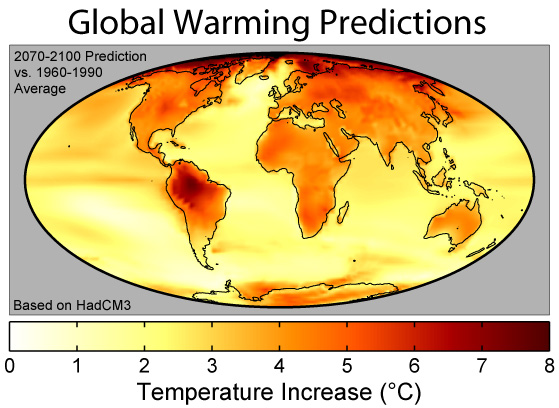
This figure shows the predicted distribution of temperature change due to global warming from Hadley Centre HadCM3 climate model. These changes are based on the IS92a ("business as usual") projections of carbon dioxide and other greenhouse gas emissions during the next century, and essentially assume normal levels of economic growth and no significant steps are taken to combat global greenhouse gas emissions.
The plotted colors show predicted surface temperature changes expressed as the average prediction for 2070-2100 relative to the model's baseline temperatures in 1960-1990. The average change is 3.0°C, placing this model towards the low end of the Intergovernmental Panel on Climate Change's 1.4-5.8°C predicted climate change from 1990 to 2100. As can be expected from their lower specific heat, continents warm more rapidly than the oceans in the model with an average of 4.2°C to 2.5°C respectively. The lowest predicted warming is 0.55°C south of South America, and the highest is 9.2°C in the Arctic Ocean (points exceeding 8°C are plotted as black).
This model is fairly homogeneuous except for strong warming around the Arctic Ocean related to melting sea ice and strong warming in South America related to predicted changes in the El Niño cycle and the possible collapse of the Amazon Rainforest. This pattern is not a universal feature of models, as other models can produce large variations in other regions (e.g. Africa and India) and less extreme changes in places like South America.
ไฟล, global, warming, predictions, ไฟล, ประว, ไฟล, หน, าท, ภาพน, การใช, ไฟล, วนกลางไม, ภาพท, รายละเอ, ยดส, งกว, าน, global, warming, predictions, 8206, กเซล, ขนาดไฟล, โลไบต, ชน, ดไมม, image, jpeg, ปภาพหร, อไฟล, เส, ยงน, นฉบ, บอย, คอมมอนส, รายละเอ, ยดด, านล, าง. ifl prawtiifl hnathimiphaphni karichiflswnklangimmiphaphthimiraylaexiydsungkwani Global Warming Predictions Map jpg 8206 559 408 phikesl khnadifl 90 kiolibt chnidimm image jpeg rupphaphhruxiflesiyngni tnchbbxyuthi khxmmxns raylaexiyddanlang epnkhxkhwamthiaesdngphlcak ifltnchbbinkhxmmxns khxmmxnsepnewbistinokhrngkarsahrbekbrwbrwmsuxesri thi khunsamarthchwyid This image was uploaded in the JPEG format even though it consists of non photographic data This information could be stored more efficiently or accurately in the PNG or SVG format If possible please upload a PNG or SVG version of this image without compression artifacts derived from a non JPEG source or with existing artifacts removed After doing so please tag the JPEG version with Superseded NewImage ext and remove this tag This tag should not be applied to photographs or scans For more information see BadJPEG khwamyx A comparison of predictions of global warming from 8 different climate models assuming the SRES A2 emissions scenario This figure shows the predicted distribution of temperature change due to global warming from Hadley Centre HadCM3 climate model 1 These changes are based on the IS92a business as usual projections of carbon dioxide and other greenhouse gas emissions during the next century and essentially assume normal levels of economic growth and no significant steps are taken to combat global greenhouse gas emissions The plotted colors show predicted surface temperature changes expressed as the average prediction for 2070 2100 relative to the model s baseline temperatures in 1960 1990 The average change is 3 0 C placing this model towards the low end of the Intergovernmental Panel on Climate Change s 1 4 5 8 C predicted climate change from 1990 to 2100 2 As can be expected from their lower specific heat continents warm more rapidly than the oceans in the model with an average of 4 2 C to 2 5 C respectively The lowest predicted warming is 0 55 C south of South America and the highest is 9 2 C in the Arctic Ocean points exceeding 8 C are plotted as black This model is fairly homogeneuous except for strong warming around the Arctic Ocean related to melting sea ice and strong warming in South America related to predicted changes in the El Nino cycle and the possible collapse of the Amazon Rainforest This pattern is not a universal feature of models as other models can produce large variations in other regions e g Africa and India and less extreme changes in places like South America References http www metoffice gov uk research hadleycentre models modeltypes html http www ipcc ch pub un syreng spm pdf Copyright This figure was prepared by Robert A Rohde from publicly available data and is incorporated into the Global Warming Art project Image from Global Warming Art This image is an original work created for Global Warming Art Please refer to the image description page for more information xnuyatihkhdlxk aeckcayaela hruxddaeprexksarniphayitenguxnikhkhxngsyyaxnuyatexksaresrikhxngknu run 1 2 hruxrunid nbcaknithixxkodymulnithisxftaewresri odyimmiswnidhamaekikh immikhxkhwampkhnaaelapkhlng saenakhxngsyyaxnuyatrwmxyuinswnchux syyaxnuyatexksaresrikhxngknuhttp www gnu org copyleft fdl html GFDL GNU Free Documentation License true trueiflnixyuphayitsyyaxnuyat khriexthifkhxmmxns aebbaesdngthima xnuyataebbediywkn 3 0 tnchbbkhunsamarth thicaaebngpn thicathasaena aeckcay aelasngngandngklawtxip thicaeriyberiyngihm thicaddaeplngngandngklaw phayitenguxnikhtxipni aesdngthima khuntxngihekiyrtiecakhxngnganxyangehmaasm odyephimlingkipyngsyyaxnuyat aelarabuhakmikarepliynaeplng khunxacthaechnniidinrupaebbidkidtamkhwr aettxngimichinlksnathiaenawaphuihxnuyatsnbsnunkhunhruxkarichngankhxngkhun xnuyataebbediywkn hakkhunddaeplng epliynrup hruxtxetimnganni khuntxngichsyyaxnuyataebbediywknhruxaebbthiehmuxnkbsyyaxnuyatthiichkbnganniethannpayaesdngsthanalikhsiththinithukephimephuxihepniptamkarepliynaeplngsyyaxnuyatkhxngmulnithiwikimiediy cak GFDL ipyng GFDL khwbkhukb CC BY SA 3 0 http creativecommons org licenses by sa 3 0 CC BY SA 3 0 Creative Commons Attribution Share Alike 3 0 true truekhabrryayodyyxithyephimkhabrryaythrrthdediywephuxkhyaykhwamwaiflnimixairxngkvsIts shows us global warming ixethmthiaesdngxyuiniflniprakxbdwysthanalikhsiththimilikhsiththisyyaxnuyatGNU Free Documentation License version 1 2 or later xngkvsCreative Commons Attribution ShareAlike 3 0 Unported xngkvsMIME type xngkvsimage jpeg prawtiifl khlikwnthi ewlaephuxduiflthipraktinkhnann wnthi ewlarupyxkhnadphuichkhwamehn pccubn21 43 10 phvscikayn 2550559 408 90 kiolibt Toony Information Description Global Warming Predictions Map Source gwart Date Author GWart Permission other versions 21 40 10 phvscikayn 2550559 408 90 kiolibt Toony Information Description Global Warming Predictions Map Source GWART Date Author GWART Permission other versions 21 36 10 phvscikayn 2550559 408 45 kiolibt Toony Information Description Global Warming Predictions Map fr Source GWART http www globalwarmingart com wiki Image Global Warming Predictions Map jpg Date nov 2007 Author GWART Permission other versions 15 20 24 knyayn 2549559 408 90 kiolibt Nils Simon 13 55 10 emsayn 2549559 408 90 kiolibt Pflatau Summary thumb right 250px A comparison of predictions of global warming from 8 different climate models assuming the SRES A2 emissions scenario This figure shows the predicted distribution of temperat hnathimiphaphni hnatxipni oyngmathiphaphni phawaolkrxn karichiflswnklang wikixuntxipniichiflni karichbn azb wikipedia org ۲۰ یوز ایل karichbn az wiktionary org iklim karichbn bg wikipedia org Globalno zatoplyane karichbn de wikipedia org Wikipedia Fotowerkstatt Archiv 2006 Oktober Agostino Merico karichbn el wikipedia org Epiptwseis ths klimatikhs allaghs karichbn en wikipedia org 2000s User Dragons flight Images Wikipedia Today s featured article June 2006 Wikipedia Today s featured article June 21 2006 User UBeR GWcleanup User Camacan User Camacan userboxes User Global Warming Wikipedia Reference desk Archives Science 2009 February 21 Key events of the 20th century User Mytwocents Globalnull Warmingnull Wikipedia Village pump technical Archive K User Phoenix B 1of3 UBX Global Warming User Aymdaman777 Migration of marine species in the Northern Atlantic Ocean karichbn en wikinews org Kyoto Protocol comes into effect Wikinews Template messages Infoboxes British scientists claim 2005 warmest yet in Northern Hemisphere Australian Labor Party announces new Climate Change Policy Australian government says technology could reduce emissions three times more than Kyoto US senators on Greenland tour People rally worldwide for action against climate change World climate conference in Nairobi IEA warns bleak future for the World without more energy investment Template Climate change Scientist Sulfur remedy for greenhouse effect backed by data Warming oceans make it harder for fish to breathe New Zealand Green party rates other parties on climate change policies Study Arctic ice could be gone by 2020 Climate campaigners scale UK Parliament and hang protest banners from the building EU US declare intent to cooperate on climate change at summit User SriMesh Robert Peary Anniversary Expedition G8 leaders set new emissions target Hopes for treaty on climate begin to wither Erosion influences Nigerian climate policy Scientists Snow on Mt Kilimanjaro to melt in twenty years Public access to information on emissions from European industries IPCC claims about Himalayan glaciers were not based on science Healing ozone layer may contribute to global warming IPCC chief refuses to apologize for glacier error User ThatGirlFromUOW Cyclone Pam prompts discussions to increase global aid funding Template Infobox lookup Climate change Glasgow Climate Pact deal struck nations to reduce coal usage karichbn en wikiversity org User Mimosa Forsyth karichbn es wikipedia org Wikiproyecto Ecologia y medio ambiente Taller dukarichthwolkephimetimkhxngiflni ekhathungcak https th wikipedia org wiki ifl Global Warming Predictions Map jpg, wikipedia, วิกิ หนังสือ, หนังสือ, ห้องสมุด,